.
Cooperation and Fairness in Multi-Agent Reinforcement Learning
Published in the ACM Journal on Autonomous Transportation Systems
Presented at Coordination and Cooperation in Multi-Agent Reinforcement Learning (CoCoMARL)
Reinforcement Learning Conference 2024 Workshop
-
Jasmine Jerry Aloor
MIT
-
Siddharth Nayak
MIT
-
Sydney Dolan
MIT
-
Victor Qin
MIT
-
Hamsa Balakrishnan
MIT
Abstract
Multi-agent systems are trained to maximize shared cost objectives, which typically reflect system-level efficiency. However, in the
resource-constrained environments of mobility and transportation systems, efficiency may be achieved at the expense of fairness
— certain agents may incur significantly greater costs or lower rewards compared to others. Tasks could be distributed inequitably,
leading to some agents receiving an unfair advantage while others incur disproportionately high costs. It is, therefore, important to
consider the tradeoffs between efficiency and fairness in such settings.
We consider the problem of fair multi-agent navigation for a group of decentralized agents using multi-agent reinforcement
learning (MARL). We consider the reciprocal of the coefficient of variation of the distances traveled by different agents as a measure
of fairness and investigate whether agents can learn to be fair without significantly sacrificing efficiency (i.e., increasing the total
distance traveled). We find that by training agents using min-max fair distance goal assignments along with a reward term that
incentivizes fairness as they move towards their goals, the agents (1) learn a fair assignment of goals and (2) achieve almost perfect
goal coverage in navigation scenarios using only local observations. For goal coverage scenarios, we find that, on average, the proposed
model yields a 14% improvement in efficiency and a 5% improvement in fairness over a baseline model that is trained using random
assignments. Furthermore, a 21% improvement in fairness can be achieved by the proposed model as compared to a model trained on
optimally efficient assignments; this increase in fairness comes at the expense of only a 7% decrease in efficiency. Finally, we extend
our method to environments in which agents must complete coverage tasks in prescribed formations and show that it is possible to do
so without tailoring the models to specific formation shapes.
Motivation
- Multi-agent vehicular systems, where large numbers of vehicles coordinate to execute complex missions, have the potential to transform the transportation and mobility domains.
- Despite the differences in application domains, these operations tend to occur in resource-constrained environments where it is important to make efficient use of resources; however, the quest for efficiency alone in these situations can often mean that fairness is sacrificed.
- In other words, some agents (vehicles or users) may receive significantly better or worse outcomes relative to others.
- We require methods that can guide agents to achieve the desired behavior of efficiency and fairness.
Efficiency vs. Fairness
MARL optimized for efficiency alone:
Figure 1: Multi‐agent systems are trained to maximize shared cost objectives. In resource‐constrained environments, efficiency may be achieved at the expense of fairness — certain agents may incur significantly greater costs or lower rewards compared to others in the system. Tasks could be distributed inequitably, leading to some agents receiving an unfair advantage while others starve for resources.
MARL optimized for fairness and efficiency:
Figure 2 Can agents learn to complete tasks fairly without significantly sacrificing efficiency (e.g., improving fairness without increasing total distance)?
Method
Our environment comprises agent, obstacle, and goal entities. Agents navigate to goals so that each agent reaches a unique goal while avoiding collisions.
Fairness Metric
We choose the distance traveled by agents to reach their goals as the resource to be treated fairly. We want to minimize the standard deviation of the distance traveled among all agents. With the distance traveled at each time step t, the mean μt and standard deviation σt are computed. The fairness metric is:Goal assignment schemes
Random goal assignment
Here, agents are assigned to goals randomly.
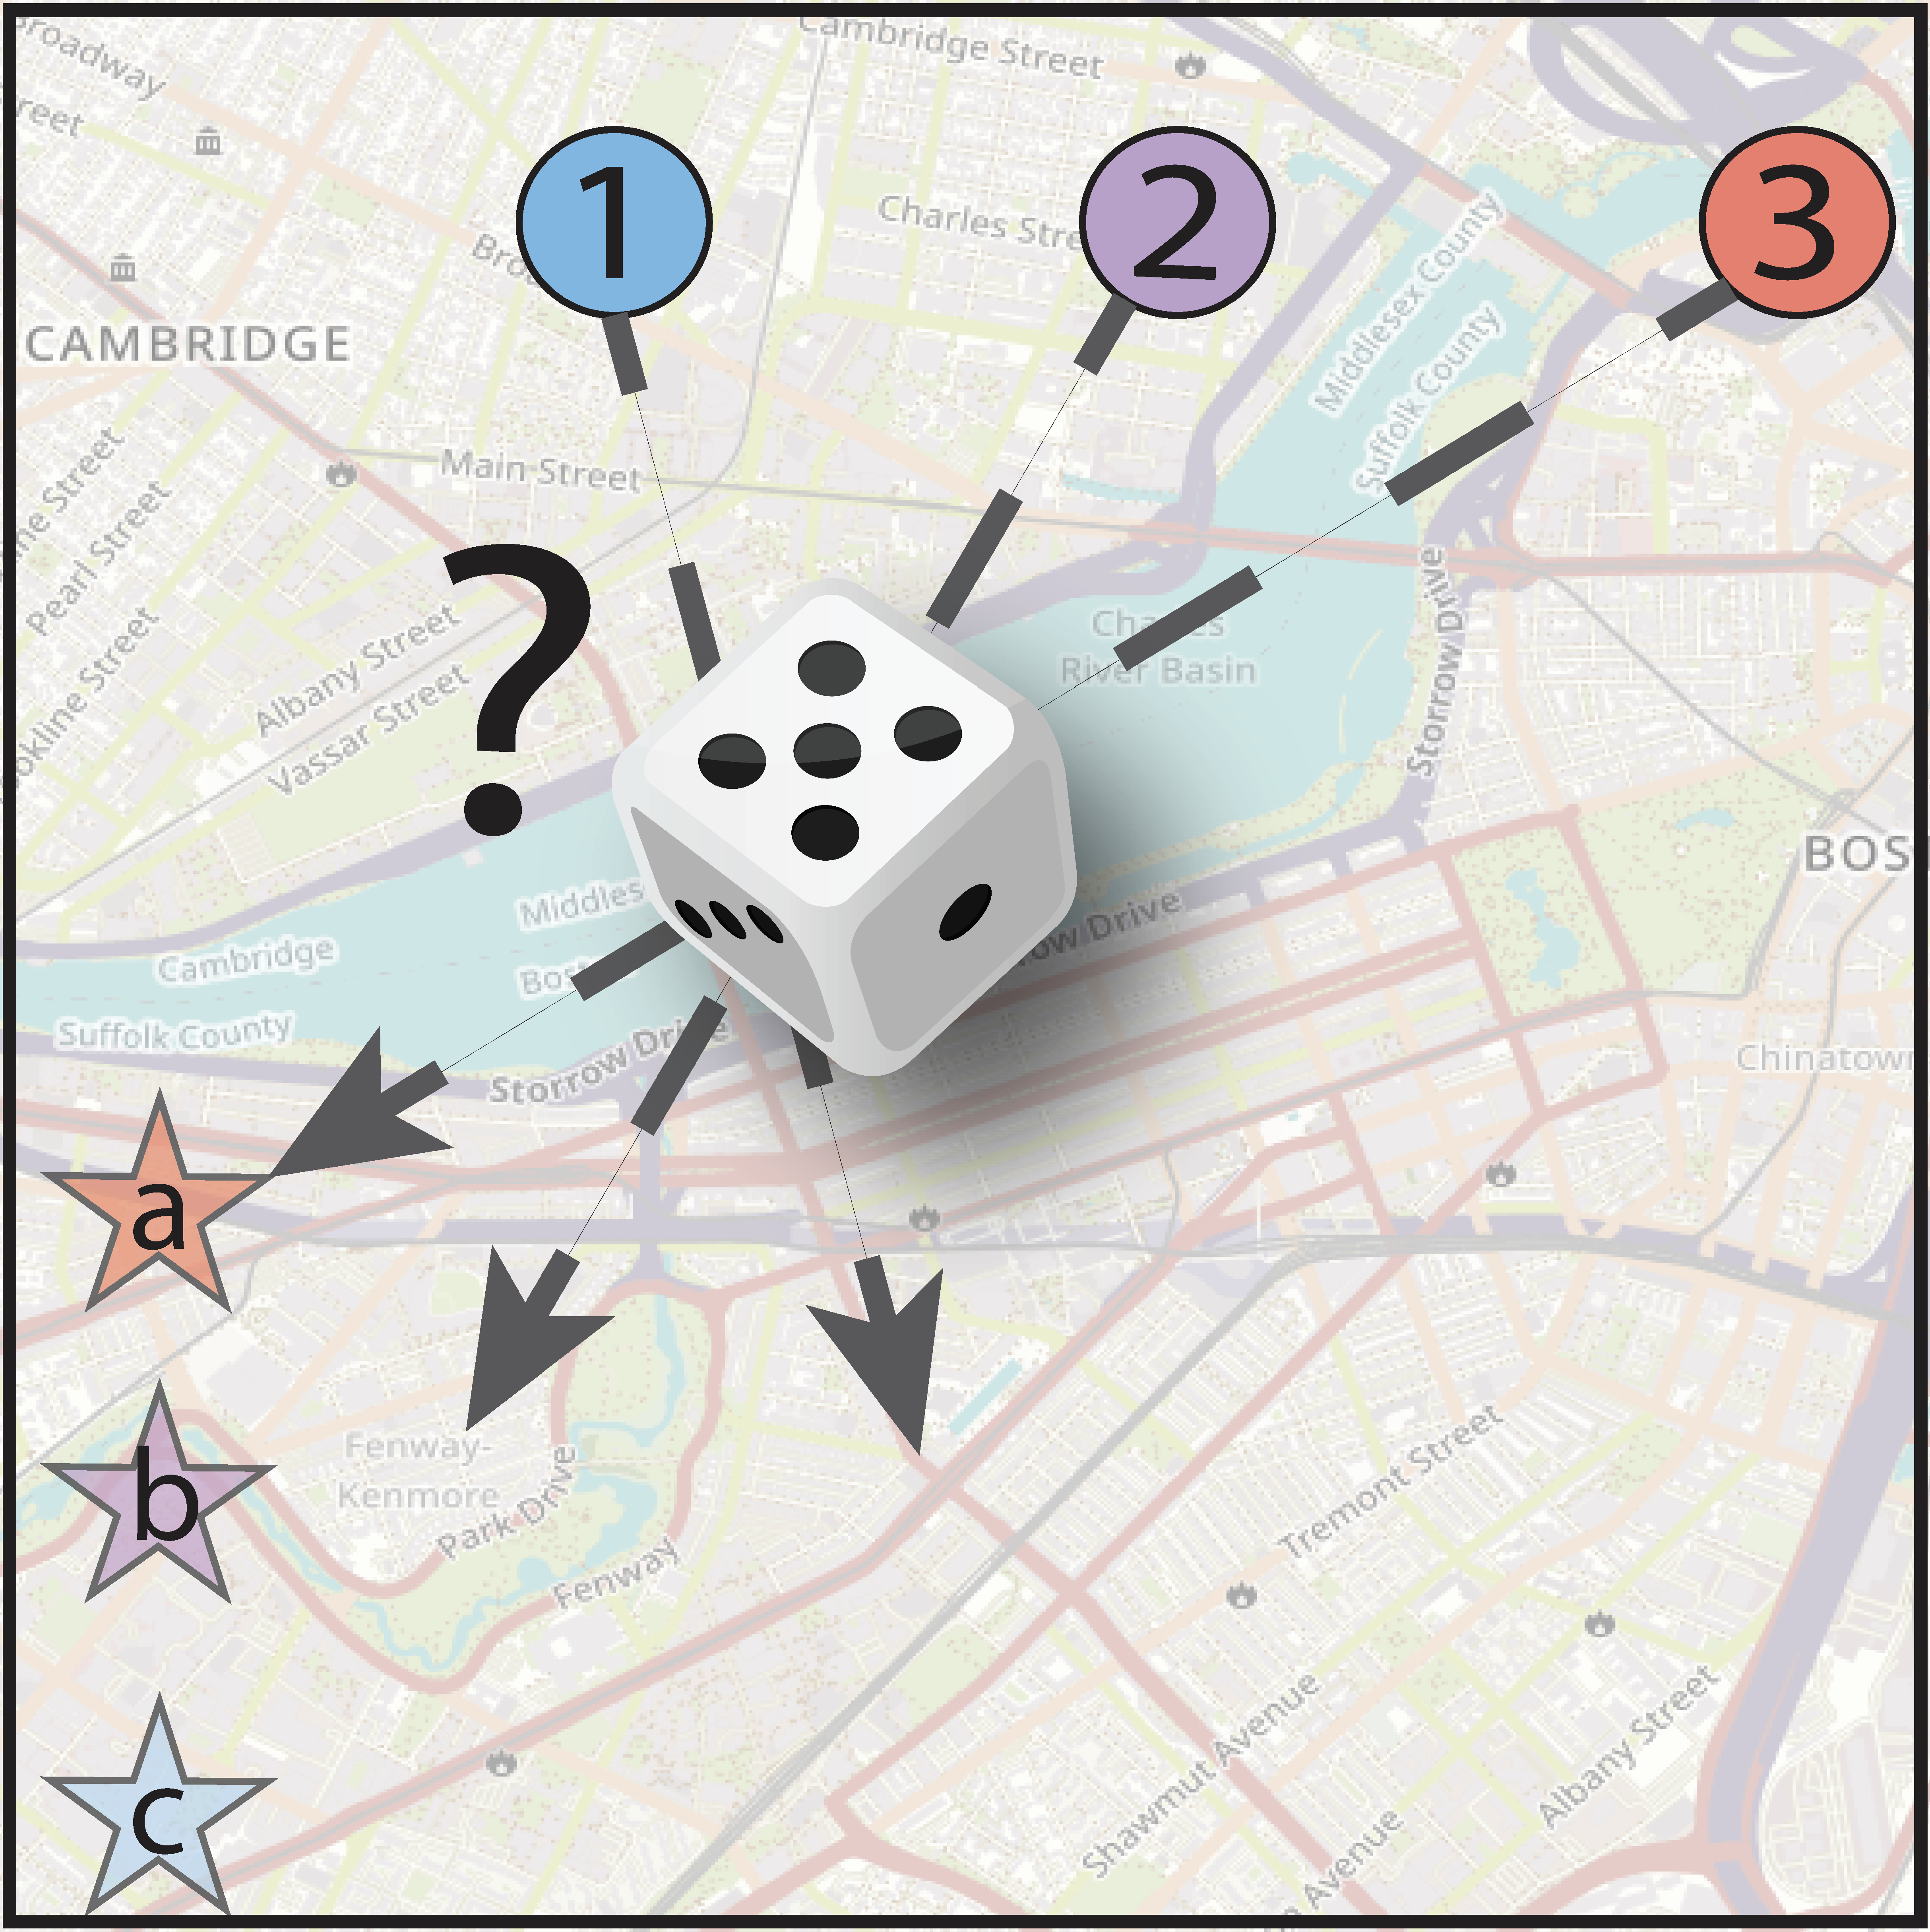
Optimal distance cost assignment
Each agent i is matched to a goal j so that the total cost Cij for all agents is minimized, which here corresponds to minimizing the total distance.
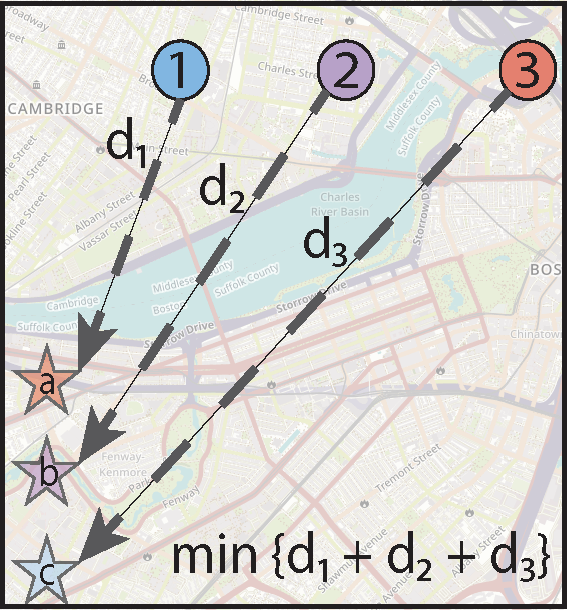
Min‐max fair assignment
Min‐max fairness is a popular concept that reduces the worst‐case cost in the assignment. We determine a min‐max fair assignment by optimizing the objective min z where z represents the maximum cost assigned to any agent
Reward Structure
The assigned goal information is provided to the agent based on the value of the distance‐based reward Rd(st, a(i) t ). When an agent reaches its goal, it receives an additional goal‐reaching reward Rg(st, a(i) t). We penalize collisions with −C.Agent Training Framework
Figure 3: Overview of our method - Fair MARL
Overview of the training: In the navigation scenario, we track the path of the agents as an episode progresses. Frame A: Each episode starts with entities initialized randomly. Agent 1’s observation vector and sensing radius are shown. Frames B and C: At every time step, for each agent, the fairness metric Ft is computed along with each agent’s rewards. The agents are assigned goals randomly or based on an optimal or fair distance cost. Frame D: Once an agent reaches the assigned goal, it is given a goal reward Rg and is flagged ”done” for that episode.
Evaluation Framework
- Each agent can go to any goal in the environment.
- Agents rely on their local observations and the learned assignments.
- No rewards are provided as agents do not rely on a centralized critic.
Example Experiment
(a) RandAssign,NoFairRew (RA)
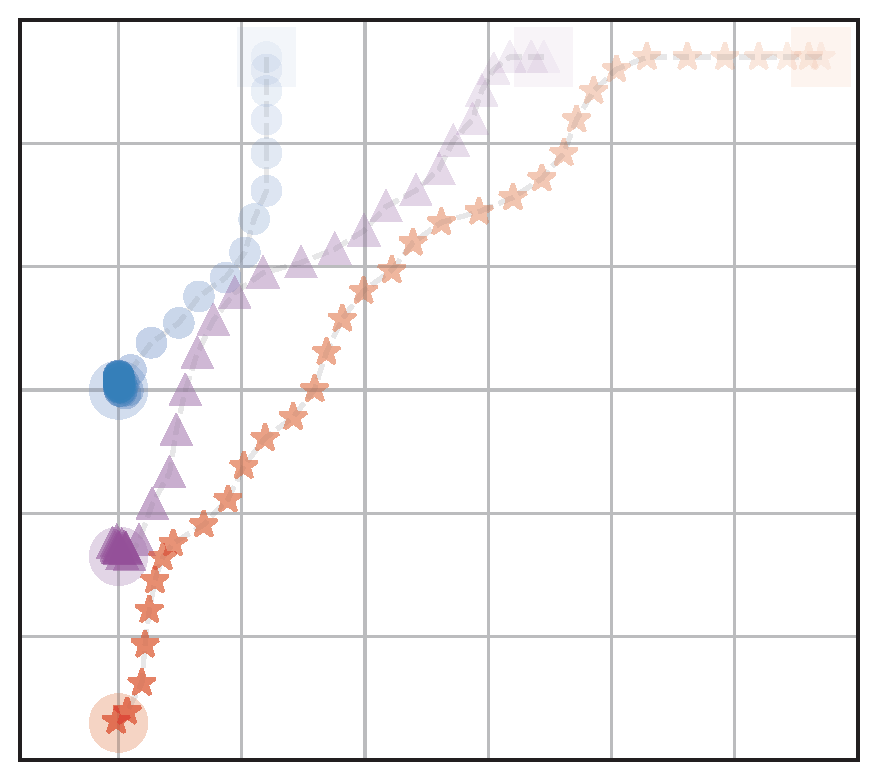
b) OptAssign,NoFairRew (OA)
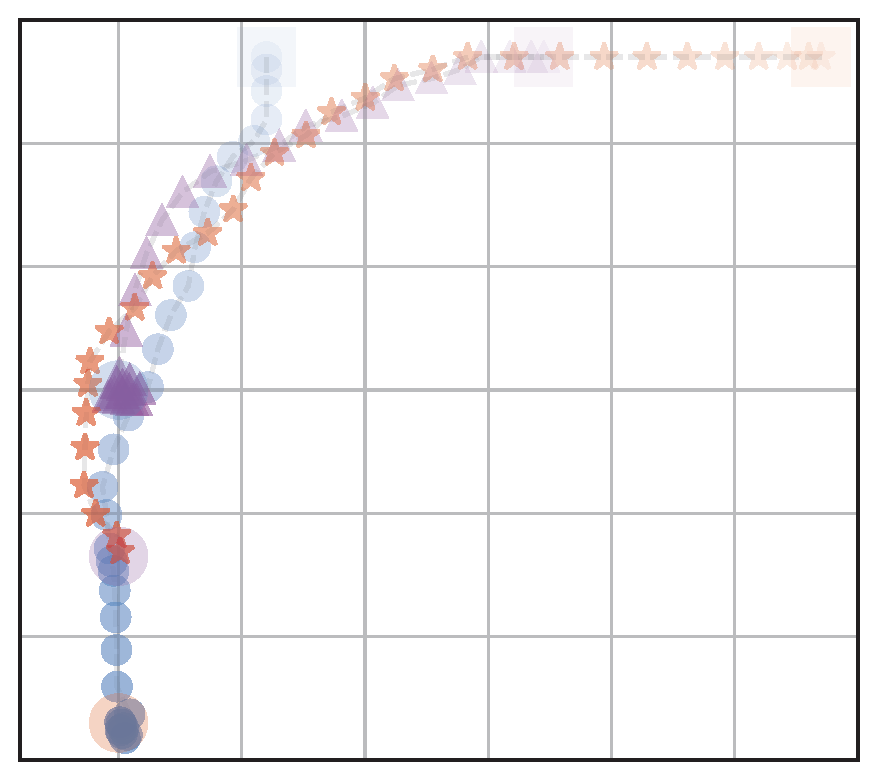
(c) FairAssign,NoFairRew (FA)
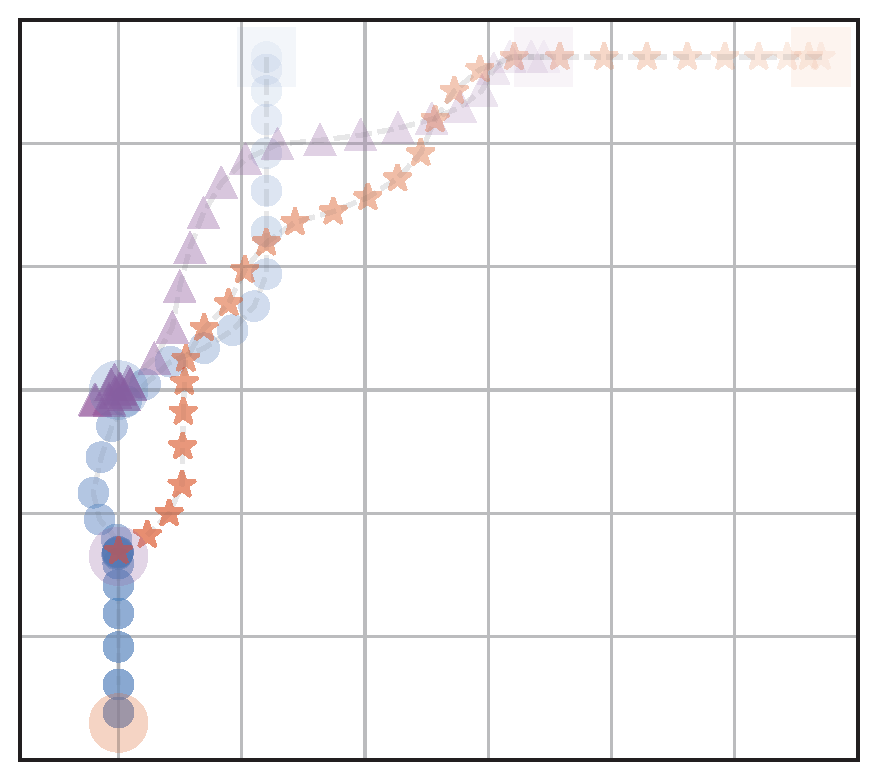
(d) FairAssign,FairRew (FA+FR)
Figure 4: Visualization of behaviors of the four navigation models: We test with different assignment methods with and without a fairness reward. The agents start from the upper half and navigate to goals located on the bottom left part
Example Experiment Results
We calculate the following metrics to determine the performance of our method:
- Fairness, 𝓕 (higher is better); which is the total fairness value obtained at the end of the episode.
- Success rate as the percentage of agents able to get to unique goals and become 'done' denoted by S (higher is better).
- Episode fraction, T (lower is better). The fraction of an episode time all agents take to reach their goal, T is set to 1 if any agent does not reach its goal.
- Distance, D (lower is better) The total distance traveled by the group of agents per episode.
Table 1: Evaluation metrics calculated for the four navigation scenarios shown in Fig. 4. We see that the model that is trained with fair goal assignments and fair rewards (FA+FR) has the best balance of fairness and efficiency (distance traveled).
| | Model . | | Fairness, 𝓕 (↑ better) . | | Success, S% (↑ better) . | | Episode fraction, T (↓ better) . | | Distance, D (↓ better) . |
|---|---|---|---|---|
| RA | 6.50 | 66.7 | 1.00 | 10.81 |
| OA | 3.45 | 100.0 | 0.68 | 9.36 |
| FA | 4.81 | 100.0 | 0.64 | 9.96 |
| FA+FR | 6.14 | 100.0 | 0.62 | 9.82 |
Key Takeaway: Agents learn fair behavior without a significant decrease in efficiency when trained with a fair goal assignment and a fairness reward.
Comparison over 100 episodes
We compare our method with a few different MARL baselines in the Target environment.(a) With 3 agents.
(b) With 10 agents
Creating Formations with Multiple Agents
Figure 6: We extend our method to agents coordinating and forming various shapes. Various shapes are created using a set of ”expected positions” around one or two landmark positions. The agents use these expected positions as goals.
Comparison over 100 episodes
(a) With 3 agents.
(b) With 5 agents
(c) With 10 agents
Performance in Congested Environments
Figure 8: Congestion in the environment: The figure on the left shows an environment with 3 agents along with 3 obstacles and 2 walls. The figure on the right shows the environment with 7 agents and 3 obstacles. The environment is crowded with the increased number of agents, which decreases free space for navigating in straight lines.
Comparison over 100 randomly initialized congested environments
(a) With 3 agents.
(b) With 5 agents
(c) With 10 agents
Conclusions
- Our proposed model (FA+FR) incorporated training agents using min-max fair distance goal assignments along with a reward term to incentivize fairness during their movement. Our results show agents can learn fair assignments without needing to significantly sacrifice efficiency.
- Additionally, our model achieved almost perfect goal coverage even when tested on a larger number of agents than training, showing the scalability of our approach.
- We showed that our method is able to generalize to different formation shapes and achieve complete coverage without retraining the models.
Future Work
- Include other measures of fairness to evalaute in diverse scenarios.
- The development of heuristics for large-scale, highly-congested environments,
- Extending the proposed approach to the fair and efficient creation of dynamic formations using multiple vehicles.
Contact
For any questions, please contact Jasmine.
Citation
If you find our work or code useful in your research, please consider citing the following paper:
Related Links
Other related papers and works
-
Layered Safe MARL:
Resolving Conflicting Constraints in Multi-Agent Reinforcement Learning with Layered Safety.
-
InforMARL:
Scalable Multi-Agent Reinforcement Learning through Intelligent Information Aggregation.
-
Application
of InforMARL for space traffic management with
minimum information sharing.
Acknowledgments
The authors would like to thank the
MIT SuperCloud
and the Lincoln Laboratory Supercomputing Center for providing
high-performance computing resources that have contributed to
the research results reported within this paper.
This work was supported in part by NASA under grant #80NSSC23M0220 and the University Leadership Initiative (grants #80NSSC21M0071 and #80NSSC20M0163),
but this article solely reflects the opinions and conclusions of its authors and not any NASA entity. J.J. Aloor was also supported in part by a Mathworks Fellowship.
This website template was edited heavily following the base from Michaël Gharbi and
Matthew Tannick.